WiseCleaner Think Tank
Encounter difficult computer problems?
All about maintenance and optimization of your Windows System.
Oct 17, 2024
While most laptops and desktop computers are equipped with Solid-State Drives (SSDs), which offer significantly faster speeds than traditional Hard Disk Drives (HDDs), the performance can still be influenced by the application and task at hand due to the number of reads and writes.
To check drive activity and understand performance, or to troubleshoot storage-related issues on Windows 11, you can utilize the Task Manager and Resource Monitor. These tools provide real-time insights into transfer rates, response times, and other information.
One of the most accessible tools for monitoring drive activity is the built-in Task Manager.
You can open Task Manager by pressing Ctrl + Shift + Esc or right-clicking on the taskbar and selecting Task Manager.
Click on the Performance tab. Here, you will see a summary of your CPU, memory, disk, and network usage. Select Disk to get a detailed look at real-time disk activity, including read and write speeds.
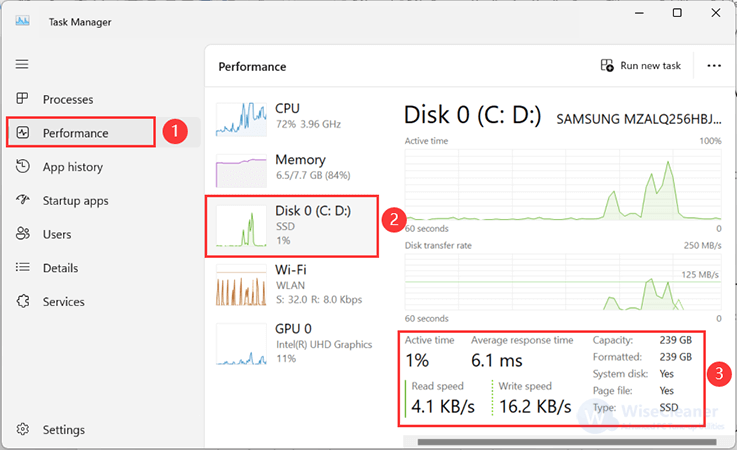
By the way, under the Processes tab, you can sort the running processes by disk usage to identify which applications are currently utilizing your disk the most.
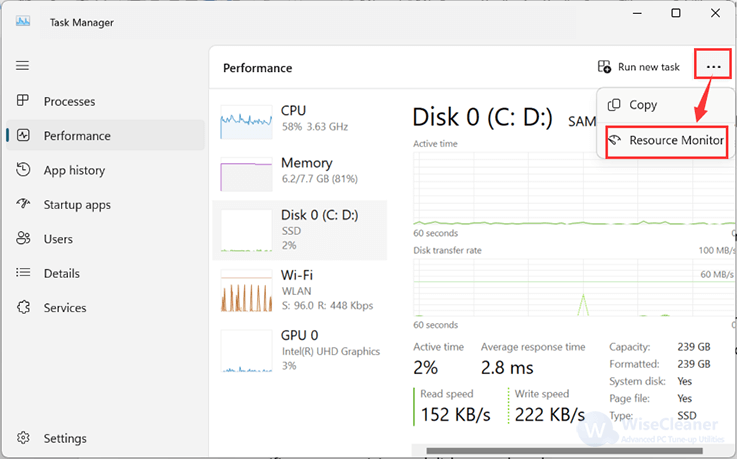
For more detailed insights, Resource Monitor is a powerful tool available in Windows 11.
You can access it by searching for Resource Monitor in the Start menu or through the performance tab of the Task Manager by clicking on Open Resource Monitor at the bottom.
Here, you can view detailed information about disk activity, including total disk usage, specific process activity, and disk queue length.
Check the Processes with Disk Activity section to read and write speeds (Bytes per second) for processes that are currently using or have recently used disk resources.
Check the read and write speeds for each of the system processes. Then, check the overall operations per second (IOPS) or bandwidth in the Disk Activity tab header.
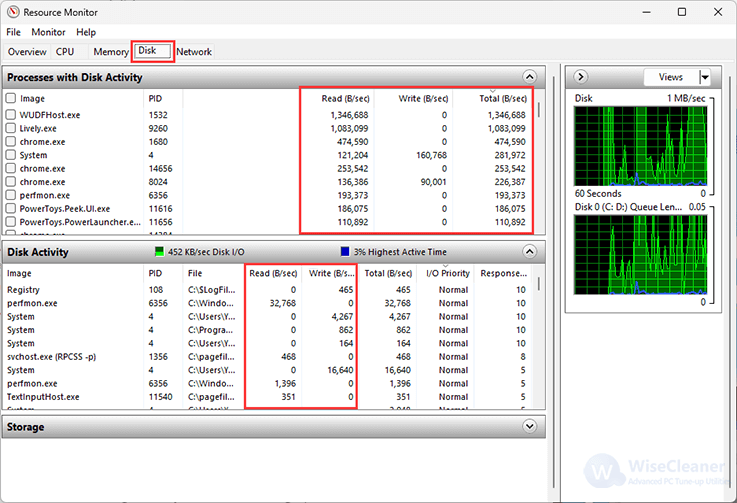
On the right side, you'll find graphs for each drive available on your computer. The top graph displays the IOPS (Input /Output Operations Per Second) for the drives, while the Queue Length graphs offer insights into drive performance.
For instance, a high queue length indicates that the disk is overwhelmed and struggling to keep up with incoming read and write requests. This situation results in numerous requests waiting to be processed, leading to delays and often correlating with reduced drive performance. Conversely, a low queue length generally shows that the disk is efficiently managing read and write requests, with few or no pending requests. This efficiency allows programs to access data swiftly, meaning overall good drive performance.
Monitoring drive activity on Windows 11 can provide critical insights into the health and performance of your system. Whether you're using built-in tools like Task Manager and Resource Monitor, or exploring third-party applications, knowing your drive's performance can help you maintain optimal system functionality and prevent potential issues.